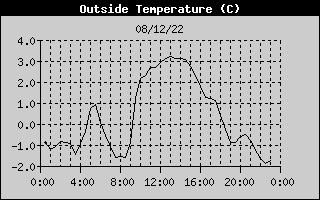
Example of chart uploaded to the WP server from the Penallt weather station.
“It represents partial success in that although I could upload images from my weather station into the WordPress server, I could only embed an image from there into a page manually. The problem is that these images are updated every 10 minutes and I don’t feel like sitting around manually embedding the new ones every 10 minutes for the rest of my life …” DM

Display below now left aligned. The file is generated by weatherlink.com which allows embedding of current conditions only. Charts can be embedded but only from the PRO version.
An alternative view of current conditions follows:
[live-weather-station-icon device_id=’wl:1d:0a:e0:8b:63′ module_id=’wl:1d:0a:e0:8b:63′ measure_type=’loc_altitude’ element=’static’ format=’none’ fx=’none’ color=’#000000′ speed=’2000′]
[live-weather-station-lcd device_id=’wl:1d:0a:e0:8b:63′ module_id=’m1:c0:00:00:00:01′ measure_type=’aggregated’ design=’standard’ size=’small’ speed=’2000′]
<iframe src="https://drive.google.com/file/d/11UtfbBFKMZdVFXZFI8nJ0omBE7lfdt2x/preview" width="480" height="300" style="border:none; background:none; allow="autoplay"></iframe>Last 24 hours