Weather data recording started in Penallt in March 2011. The charts below show the monthly summaries from January 2018 until the end of December 2018 and also compare Penallt’s 2018 weather with the 1981-2010 overall average data for Usk, the nearest place (16 km by crow) for which reliable data exist.
Monthly maximum and minimum temperatures
The chart shows that Penallt monthly averages mirrored the long term averages for Usk pretty well overall, with February and March being significantly colder than usual (the Beast from the East“, etc) and June and July being much warmer.
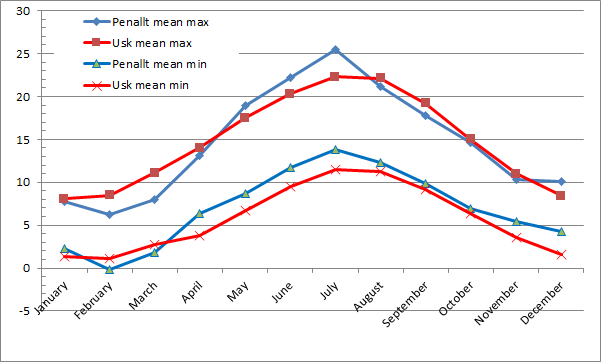
- July 8th was the warmest day of the year with a maximum of 30.6°C
- March 1st had the lowest maximum temperature of -3.3°C; there were three other days with sub zero all day.
- Warmest by night was July 9th with a minimum of 16.9°C
- Coldest by night was February 28th, with a minimum temperature of -7.6°C
- There were 93 days on which the temperature exceeded 20°C and 37 when it was below 0°C
- The mean annual temperature was 10.7°C, equal to the 2014 record warm year.
The mean annual temperature for England and Wales (1845 to 2012) is 9.3°C. The 2018 figure for Penallt is thus 1.4°C above the England/Wales average and is the equal warmest in Penallt since records began in 2012.
Rainfall The chart shows the usual uneven distribution of rainfall throughout the year. Three months had in excess of 100 mm falling, with December’s 196.2 mm being the wettest. By contrast, June was a remarkably dry month (16.0 mm).
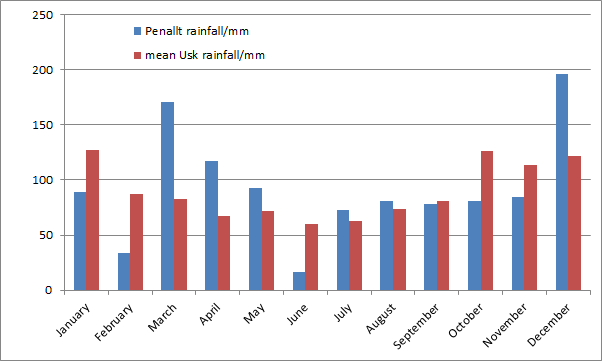
Overall, the total rainfall for 2017 was 1112.8 mm (43.8 inches), 3.3% above the average Usk total of 1076.9 mm (42.4 inches) showing that the year had average rainfall overall.
- Rain was recorded on 190 days in the year
- The wettest day was July 29th when 51.6 mm fell
- 20 mm or more fell on 8 different days
Further details
Much more information about month by month descriptions of weather in this year as well as the detailed daily data is available here.