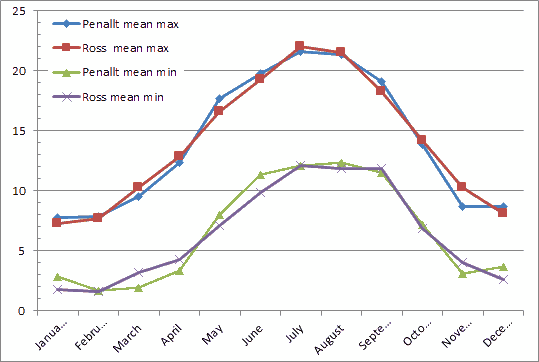
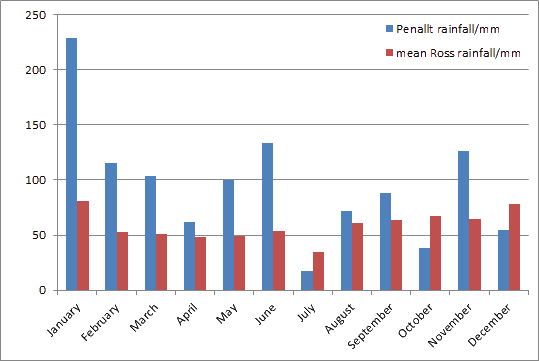
Weather data recording started in Penallt in March 2011. The charts below show the monthly summaries from January 2016 until the end of December 2016 and also compare Penallt’s 2016 weather with the 1971-2000 overall average data for Ross-on -Wye, the nearest place for which reliable data exist.
Monthly maximum and minimum temperatures
The chart shows that Penallt monthly averages mirrored the long term averages for Ross pretty well overall, with November showing the biggest difference, being 1.6°C below.

- July 19th was the warmest day of the year with a maximum of 31.2°C
- January 19th had the lowest maximum temperature of 3.0°C; there were no days with sub zero all day.
- Warmest by night was September 6th with a minimum of 17.6°C
- Coldest by night was January 20th, with a minimum temperature of -4.0°C
- There were 72 days on which the temperature exceeded 20°C and 27 when it was below 0°C
- The mean annual temperature was 10.2°C, 0.5°C below the 2014 record warm year.

Overall, the total rainfall for 2016 was 1140.4 mm (44.9 inches), 61% above the average Ross total of 706.2 mm (27.8 inches) showing that the year was much wetter than normal overall – not as wet as the 1508 mm of 2014 and the 1575 mm of 2012 however, but about the same as the 1178 mm of 2015.
- Rain was recorded on 215 days in the year
- The wettest day was February 6th when 56.4 mm fell
- 20 mm or more fell on 12 different days