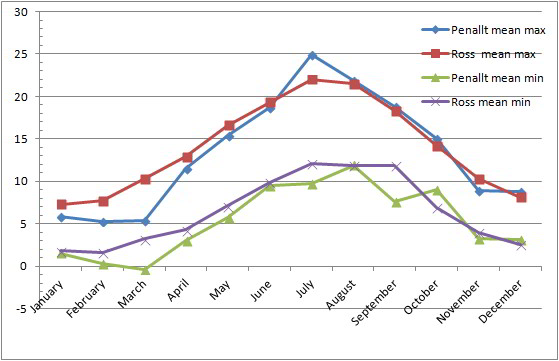
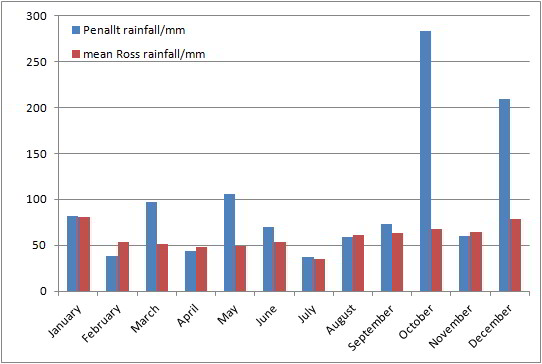
Weather data recording started in Penallt in March 2011. The charts below show the monthly summaries from January until the end of December 2013 and also compare Penallt’s 2013 weather with the 1971-2000 overall average data for Ross-on -Wye, the nearest place for which reliable data exist.
Monthly maximum and minimum temperatures
The chart shows that February and March were abnormally cool months, July was much warmer than usual. The first half of the year was cooler then average overall, and the second half was a little warmer than usual, with the exception of the cool November.
- July 13th was the warmest day of the year with a maximum of 30.8°C
- February 19th had the lowest maximum temperature of -0.9°C
- Warmest by night were July 10th and July 18th, both with a minimum of 15.6°C
- Coldest by night was March 12th, with a minimum temperature of -4.3°C
- There were 74 days on which the temperature exceeded 20°C and 57 when it was below 0°C
- The mean annual temperature was 9.5°C

Rainfall
The chart shows that two months, October and December, were very much wetter then usual, March and May had about double the normal rainfall too, whilst all others were about average..
The total rainfall for 2013 was 1158 mm (62.0 inches), 64% above the average Ross total of 706.2 mm (27.8 inches) showing that the year was wetter than normal overall. This is less than the 1575 mm of 2012 however!
- Rain was recorded on 207 days in the year
- The wettest day was December 23rd when 50.8 mm fell
- 20 mm or more fell on 12 different days

Further details
Much more information about month by month descriptions of weather in this year as well as the detailed daily data is available here.